
Remote Sensing Algorithms
Tree mortality detection and vulnerability
Landscape level monitoring of forest health and tree dieback is critical for vegetation and disaster management strategies. We develop algorithms to monitor tree health and dieoffs using multisensor observations and machine learning approaches.
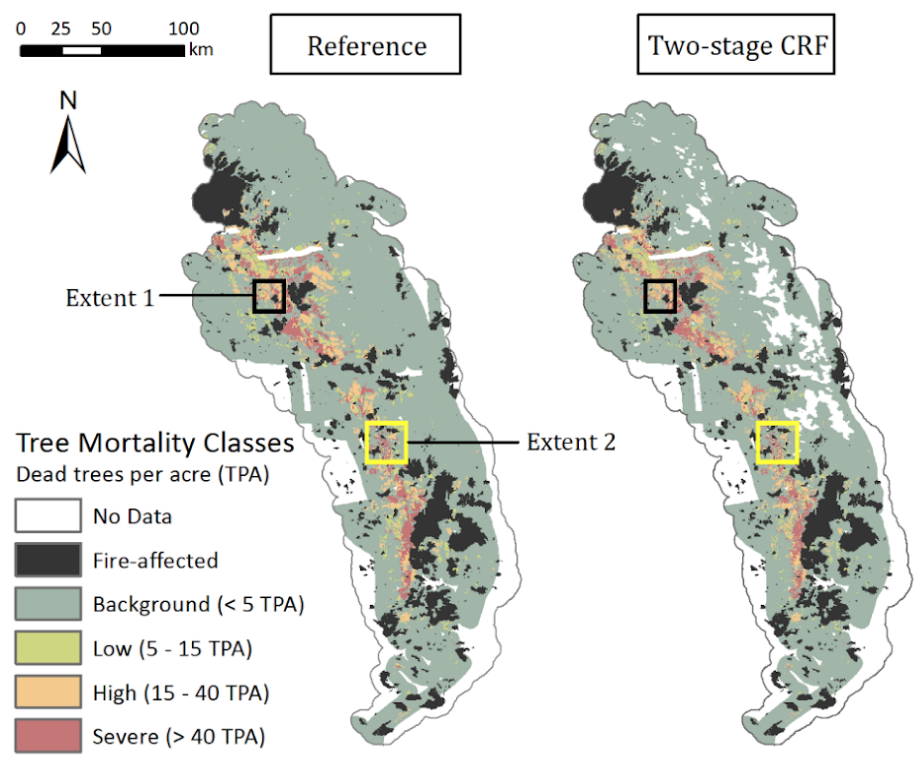 Remote sensing metrics were developed to represent baseline forest health conditions and drought stress using time series of MODIS vegetation indices (VIs) and a water index. We used Random Forest algorithms, trained with forest aerial detection surveys data, to detect tree mortality based on the remote sensing metrics and topographical variables, with an overall producer’s accuracy of 96.3% for the classification Random Forest (CRF) in Sierra Nevada forests.
Interpretations of the models revealed that forests with higher productivity preceding the onset of drought were more vulnerable to drought stress and, consequently, more likely to experience tree mortality. This method highlights the importance of incorporating baseline forest health data and measurements of drought stress in understanding forest response to severe drought.
Related Publications:
Byer, S., and Y. Jin (2017), Detecting drought-induced tree mortality in Sierra Nevada forests with time series of satellite data, Remote Sensing, 9(9), 929, doi: 10.3390/rs9090929, [PDF]
Monitoring rangeland forage production
Rangelands cover ~23 million hectares and support a $3.4 billion annual cattle industry in California. Large variations in forage production from year to year and across the landscape make grazing management difficult. Various algorithms have been developed to map forge production from centimeter to 30m resolution, using multispectral remote sensing imagery from UAV/drones, Planet commercial satellite, and Landsat satellite.
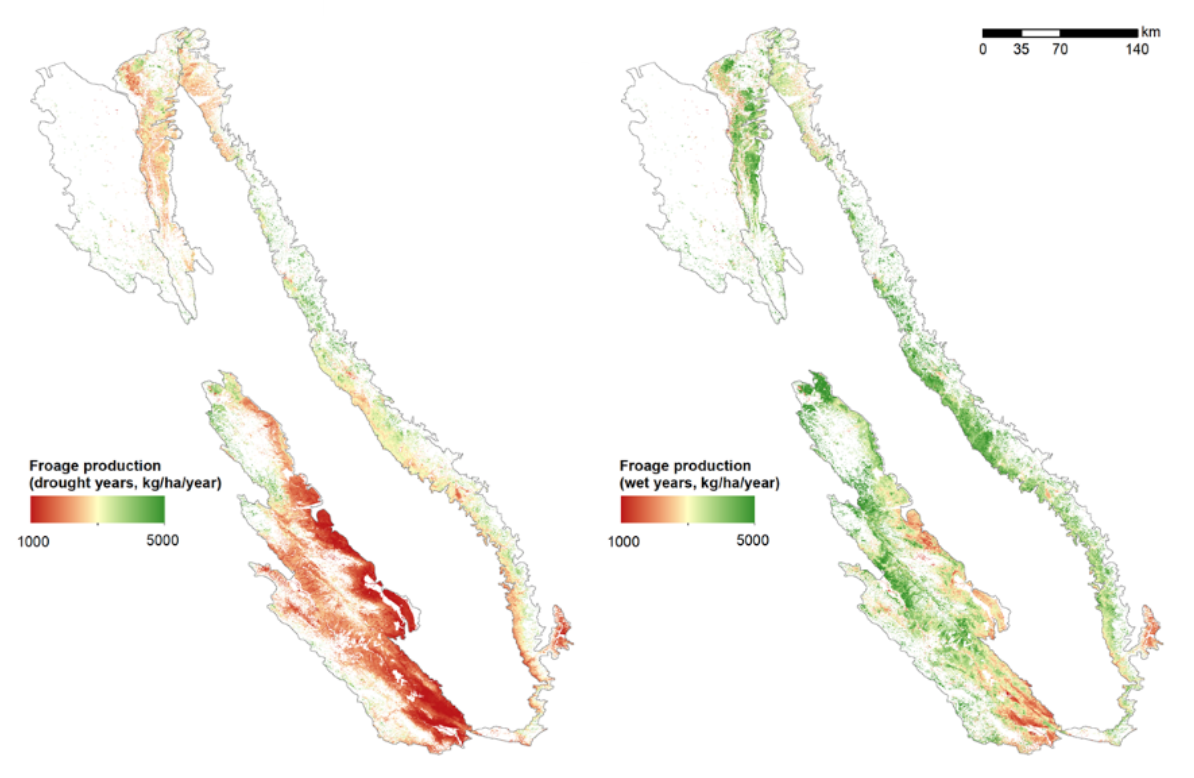 By fusing monthly 30-cm sUAS imagery and more frequent 3-m PlanetScope satellite observations, we derived 30-cm daily maps of NDVI, and estimated aboveground net primary production as a product of APAR and light use efficiency, optimized as a function of topography and climate stressors. The estimated forage production agreed well with field measurements, and captured similar seasonal and spatial patterns compared to field-based biomass measurements.
Our study demonstrated the utility of aerial and satellite remote sensing technology in supporting adaptive rangeland management, especially during an era of climatic extremes, by providing near-real-time forage production estimates.
Related Publications:
Liu, H., R. Dahlgren, R. Larsen, S. Devin, L. Roche, A. O'Geen, A. Wong, S. Covello, and Y. Jin (2019), Estimating Rangeland Forage Production Using Remote Sensing Data from a Small Unmanned Aerial System (sUAS) and PlanetScope Satellite, Remote Sensing, 11(595), doi: 10.3390/rs11050595. [PDF]
Mapping orchard characteristics: planting years, bloom conditions
 Floral phenology, the timing and intensity of flowering, is intimately tied to the reproduction of terrestrial ecosystem and highly sensitive to climate change.
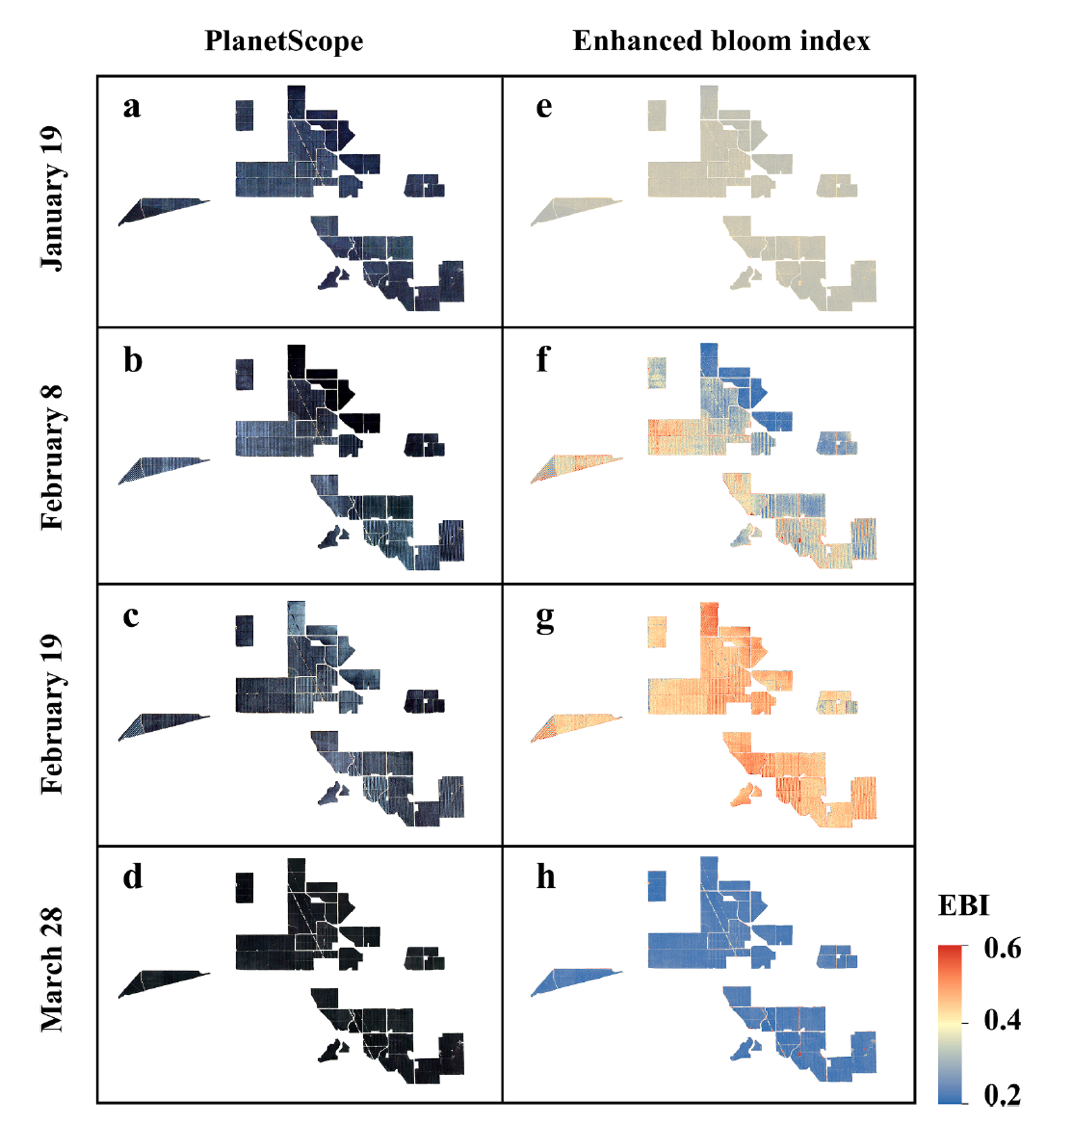
We developed an enhanced bloom index (EBI), based on the multispectral remotely sensed data, to quantify flowering status over almond orchards in California. Our test studies with the centimeter super resolution imagery from UAV demonstrated that the EBI agreed well with the bloom coverage derived from supervised classification. Experimental tests with multi-scale remote sensing observations from CERES aerial (0.2 m), PlanetScope (3 m), Sentinel-2 (10 m), and Landsat (30 m) satellite imagery further showed the robustness of the EBI in tracking the flower conditions and dynamics.
The relatively dense time series of PlanetScope and Sentinel-2 imagery are able to capture the bloom dynamics of almond orchards. Satellite derived EBI is expected to track the bloom information and thus improve our understanding and prediction of flower and pollination response to weather and ultimately the yield.
Related Publications:
Chen, B.. Jin, and P. Brown (2019), Automatic Mapping of Planting Year For Tree Crops using Landsat Satellite Time Series Stacks, ISPRS Journal of Photogrammetry and Remote Sensing, 151, pp176-188, doi: 10.1016/j.isprsjprs.2019.03.012.
Chen, B., Y. Jin, and P. Brown (2019), An enhanced bloom index for quantifying floral phenology, ISPRS Journal of Photogrammetry and Remote Sensing, 156, pp. 108-120, doi: 10.1016/j.isprsjprs.2019.08.006. [PDF]
Ecosystem Productivity
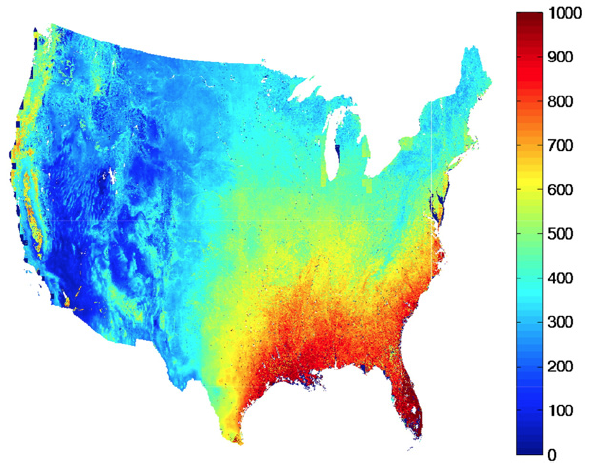
W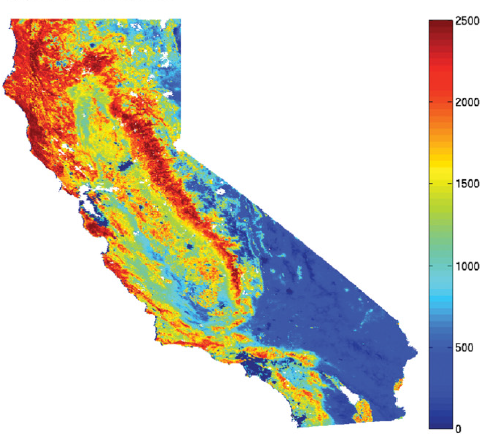 e developed an algorithm to estimate the annual cumulative absorbed photosynthetically active radiation (APAR), as a proxy for plant production (Jin et al., 2013). APAR was calculated as the product of photosynthetically active radiation (PAR) and the fraction of PAR absorbed by plant canopies (fPAR) that we derived from MODIS and AVHRR vegetation index. The annually integrated APAR derived from remote sensing was well correlated with contemporaneous in-situ Gross Primary Production (GPP) observations based on eddy covariance measurements over desert shrubland, open shrubland, closed shrubland, grassland, savanna, evergreen needleleaf forest, and mixed forest.
Related publication: Jin, Y. and M. L. Goulden (2013), Ecological consequences of precipitation variation: separating short- vs. long-term effects using satellite data, Global Ecology and Biogeography, doi: 10.1111/geb.12135. [PDF]
Remote Sensing based evapotranspiration estimate
 Evapotranspiration (ET) is an important flux that links water, carbon, and energy exchange in many ecosystems, but is considered the most uncertain component in water budget. We developed a robust and efficient way to estimate ET by integrating the AmeriFlux eddy covariance measurements and satellite-derived observations of net radiation and leaf area index. Spatial analysis of these high resolution ET estimates provided evidence for a shift from water-limited to energy-limited ET with increasing precipitation. The ET product can be used to quantify and understand the climatic and vegetation controls on water balance.
Related Publications:
Jin, Y., J.T. Randerson, and M. L. Goulden (2011), Continental-scale net radiation and evapotranspiration estimated using MODIS satellite observations, Remote Sensing of Environment, 115(9), 2302-2319, doi: 10.1016/j.rse.2011.04.031. [PDF]
Anderson, R.G., Y. Jin, and M. L. Goulden (2012), Assessing regional evapotranspiration and water balance across a Mediterranean montane climate gradient, Agricultural and Forest Meteorology, 166-167, 10-22, doi:10.1016/j.agrformet.2012.07.004. [PDF]
Burned area detection
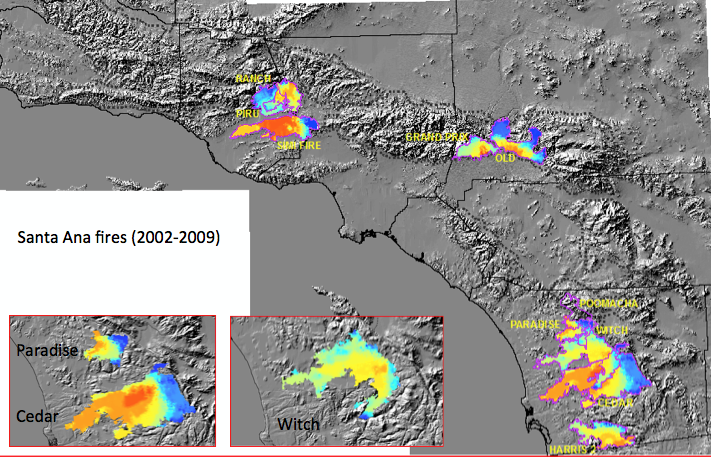
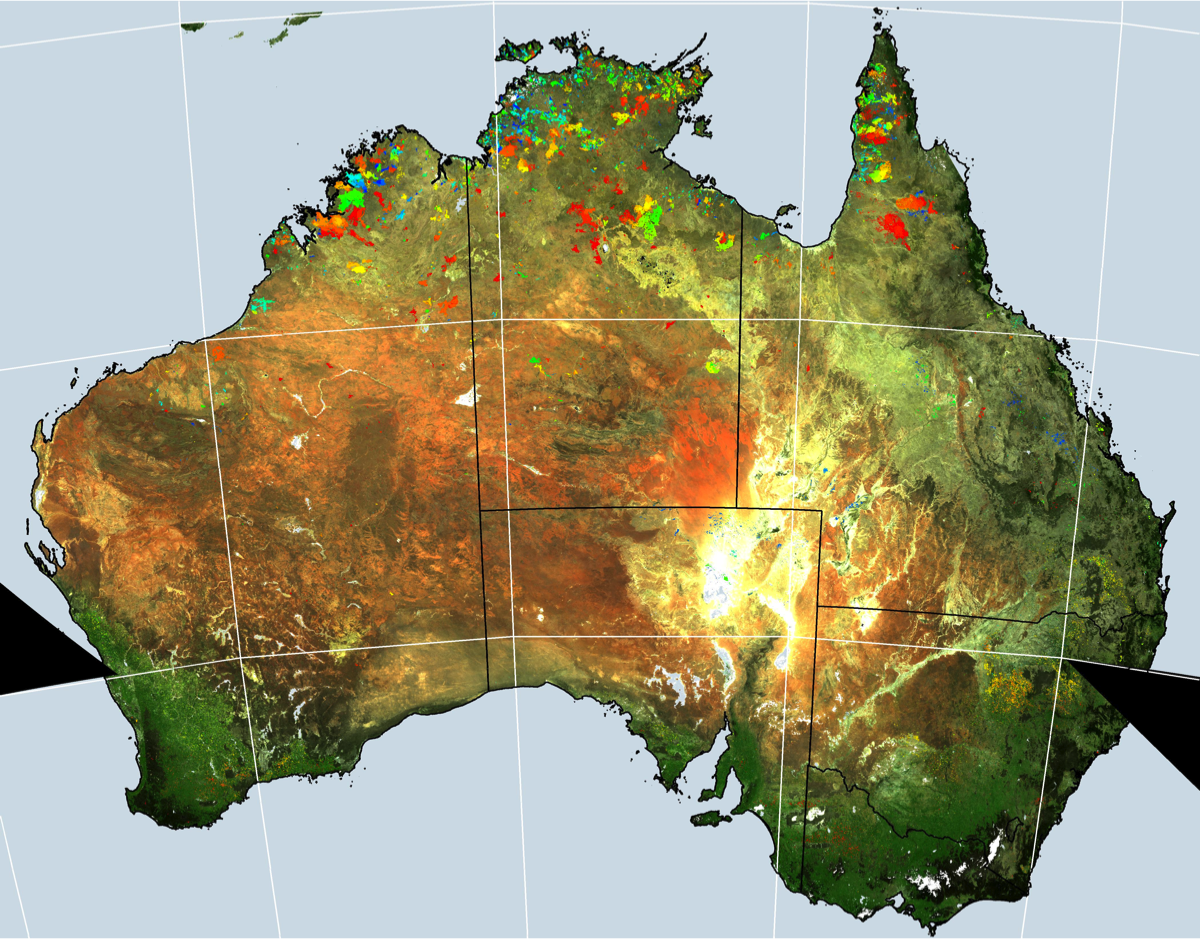 We developed algorithms to detect burned area using multi-spectral and multi-temporal satellite observations. Various metrics were also used to quantify burn severity in the boreal region. We are exploring the use of air-borne observations for fire behavior analysis to support disaster reponse efforts.
Related Publication:
Roy, D.P., Y. Jin, P. E. Lewis, and C. O. Justice (2005), Prototyping a global algorithm for systematic fire-affected area mapping using MODIS time series data, Remote Sensing of Environment, 97(2), 137-162, doi:10.1016/j.rse.2005.04.007. [PDF]
Jin, Y., J. T. Randerson, S. J. Goetz, P. S. A. Beck, M. M. Loranty, and M. L. Goulden (2012), The influence of burn severity on post-fire vegetation recovery and albedo change during early succession in North American boreal forests, Journal of Geophysical Research-Biogeosciences, 117, G01036, doi:10.1029/2011JG001886. [PDF]